
When Metrics Describe Italy, but Don’t Quite Explain It
Quando gli indici raccontano l’Italia, ma non la spiegano

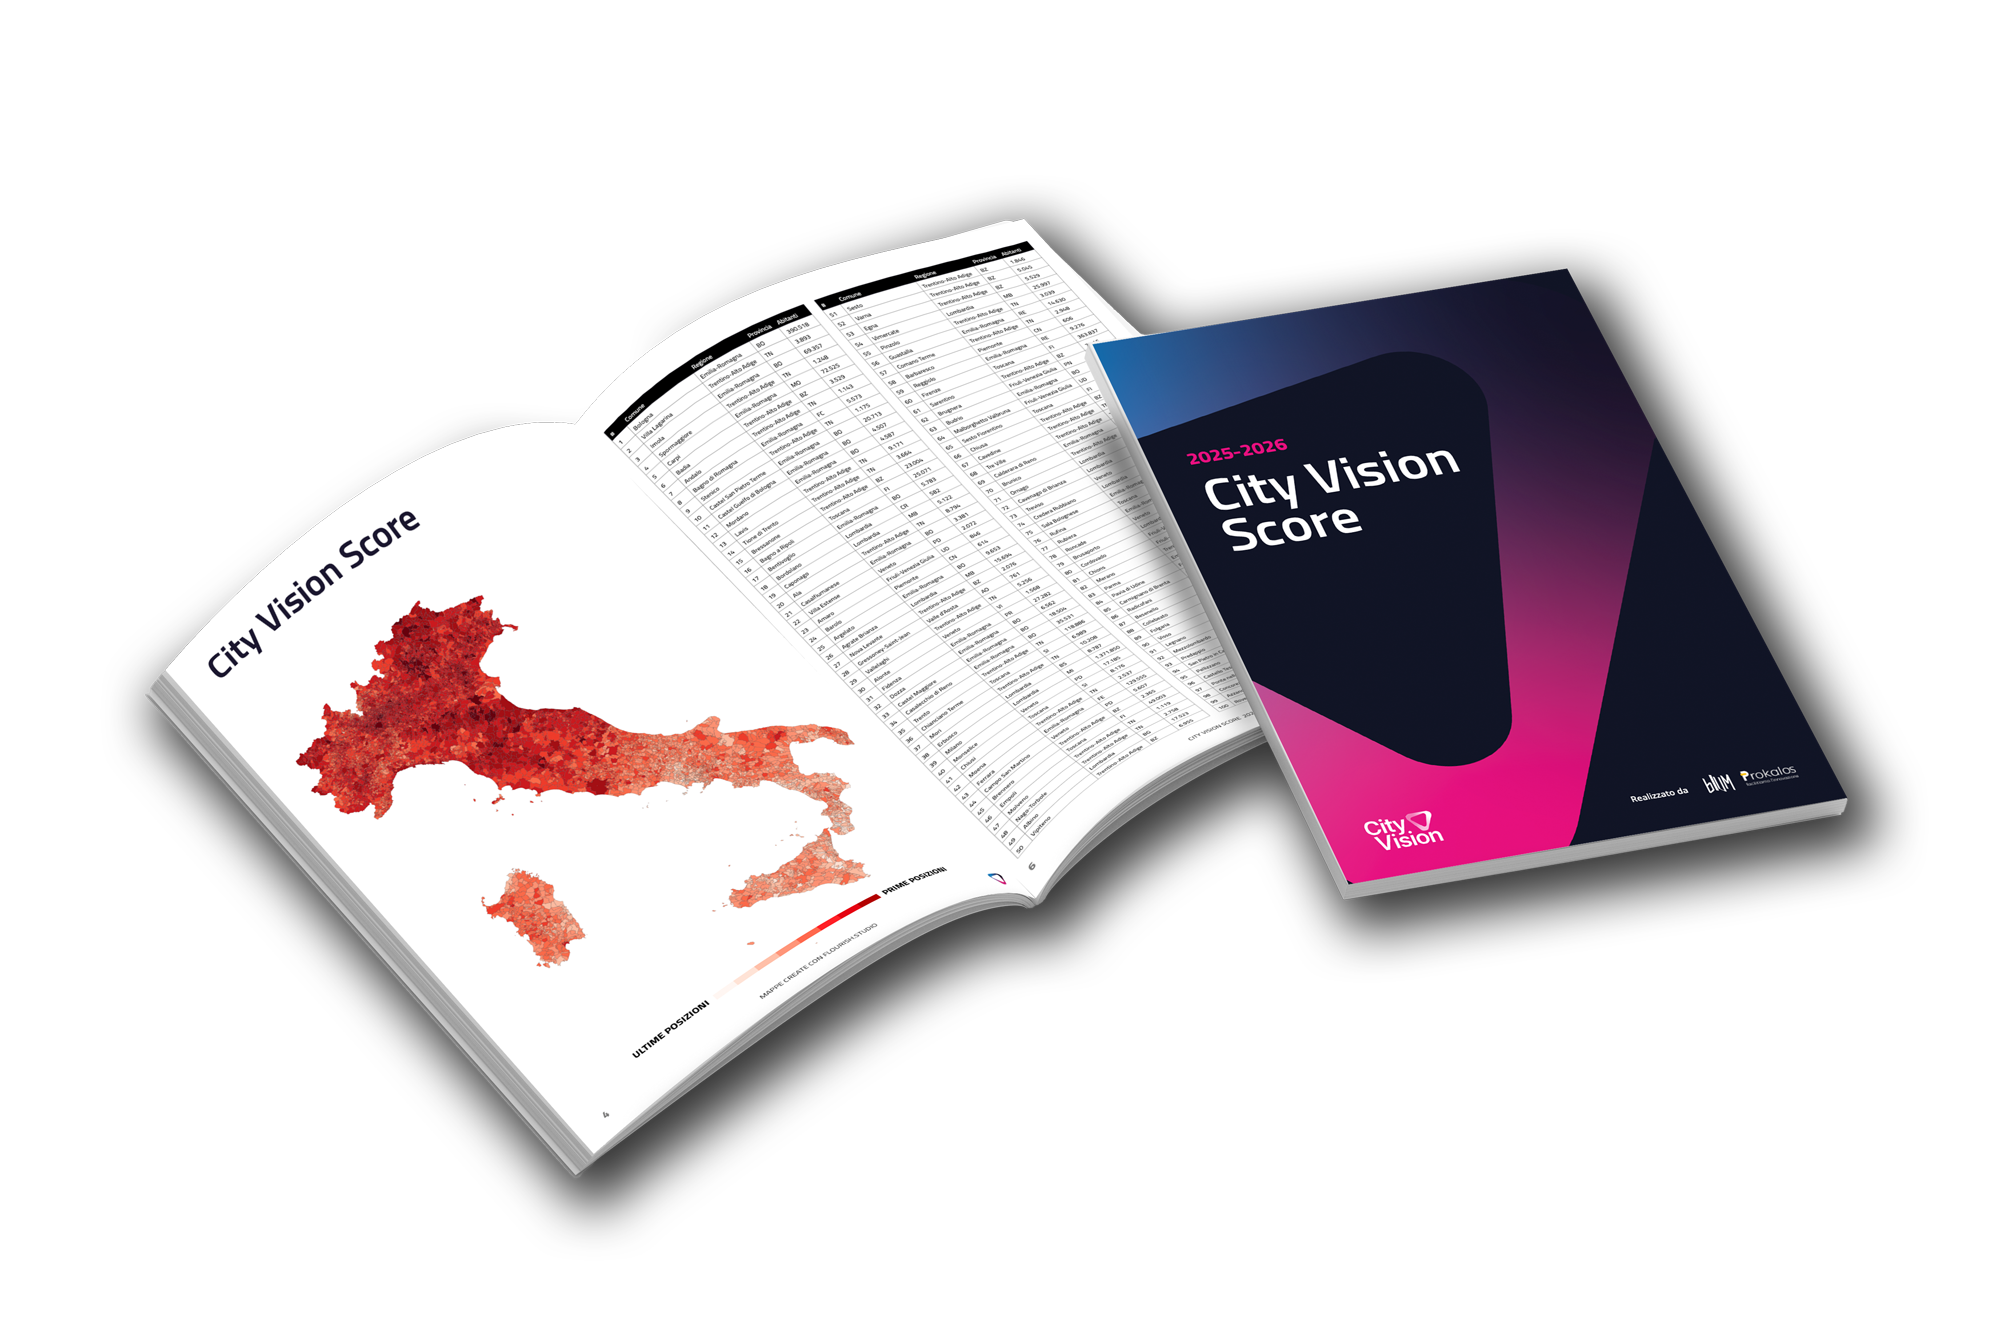
Una lettura ragionata del City Vision Score 2025–2026
Il City Vision Score 2025–2026 è uno di quei lavori che bisogna prendere sul serio. Nasce da una struttura metodologica chiara, da un archivio di dati istituzionali e da un set di indicatori che ambisce a fotografare la “smartness” dei comuni italiani nella loro evoluzione digitale e amministrativa. È un esercizio complesso e necessario, soprattutto in un Paese che raramente si osserva con un metodo comparabile su scala nazionale.
E tuttavia, proprio la sua ambizione scientifica apre una serie di questioni che meritano di essere considerate, non per demolire lo strumento, ma per capirne a fondo natura e limiti. Perché un indice non è mai soltanto un indice: è anche un modo di guardare il Paese, di interpretarlo, di renderlo leggibile. E la leggibilità, in Italia, è sempre un terreno delicato.
Il report dichiara una metodologia solide: trenta indicatori, sei dimensioni tematiche – dalla governance alla mobilità, dalla smart economy allo smart living – normalizzazione dei dati, suddivisione per fasce di popolazione e macroaree geografiche. È un impianto coerente, costruito con attenzione e con un approccio che segue fedelmente la letteratura internazionale. Ma la scienza dei territori non vive solo negli indicatori. Vive anche nelle scelte di cosa misurare, e di cosa non misurare. Vive nei pesi assegnati implicitamente, in quelle preferenze tecniche che non vengono quasi mai esplicitate, ma orientano la lettura molto più dei numeri grezzi.
Il risultato, per molti versi, è affascinante. Il Nord – soprattutto il Nord-Est – continua a dominare la scena, con Bologna, Trento, la galassia dell’Emilia-Romagna e quella del Trentino-Alto Adige a costruire un sistema amministrativo e infrastrutturale che risulta nettamente in vantaggio rispetto a molte parti del Paese. Lo stesso report lo ammette, notando come il divario non sia più un fatto episodico ma una condizione strutturale, alimentata da infrastrutture storiche, continuità di investimenti e capacità amministrativa. È una descrizione onesta, ma anche un indizio: quando un indice misura i risultati e non la distanza percorsa, finisce inevitabilmente per premiare chi parte già da una posizione favorevole.
Il caso più evidente è quello della fascia tra i 2.001 e i 50.000 abitanti, la più vasta e, paradossalmente, la più omogeneizzata. Dentro questo intervallo vivono mondi totalmente diversi: paesi di 2.300 abitanti, con tre impiegati comunali e un territorio rurale complesso da governare, vengono messi sullo stesso piano di cittadine di 40 o 45 mila residenti che ospitano ospedali, poli scolastici, servizi avanzati, imprese strutturate e una disponibilità finanziaria incomparabile. La scienza statistica richiede coerenza di classe; la realtà italiana, invece, richiederebbe di distinguere tra chi può fare molto, chi può fare poco e chi riesce a fare moltissimo nonostante tutto. In questo senso, l’indice tende ad assorbire ed eliminare la specificità del comune “piccolo vero”, quello che supera la soglia dei 2.000 abitanti ma non arriva ai 10.000. Sono proprio questi, spesso, i territori più interessanti da osservare: abbastanza grandi per essere vivi, abbastanza piccoli da essere fragili, abbastanza densi da generare comunità, ma non da sostenere strutture amministrative complesse. E invece, nello Score, vengono risucchiati nell’indistinto.
L’altra faccia del fenomeno riguarda la dimensione dello “Smart Living”. Qui i piccoli borghi sotto i 2.000 abitanti dominano con sorprendente costanza. Non perché abbiano servizi all’avanguardia, o una capacità amministrativa fuori scala, ma perché la loro stessa struttura demografica li avvantaggia: bassa densità, costo della vita moderato, coesione sociale più alta, una certa lentezza del quotidiano che diventa, nella trasformazione dell’indice, una forma di qualità della vita. È un risultato coerente con i parametri scelti, ma anche un esempio perfetto di come l’indice, pur scientifico, finisca per misurare tratti strutturali più che scelte di policy o processi di innovazione deliberata.
Questo non è un difetto in senso stretto: è la natura stessa degli indici territoriali. Ma la distanza tra ciò che si può misurare e ciò che davvero definisce un territorio rimane enorme. Per capire un comune non basta sapere quante farmacie ha, o quanti servizi digitali ha attivato. Bisogna entrarci, attraversarlo, parlare con le persone, percepire ciò che sfugge ai dataset, respirare la qualità di una strada alle otto di sera o il silenzio di un vicolo all’alba. E questo non vale soltanto per i borghi. Vale per le città medie, per le aree interne, per quei piccoli centri interstiziali che non rientrano mai nelle retoriche della “smart city”, ma che rappresentano gran parte del Paese reale.
In definitiva, il City Vision Score è un lavoro utile, serio, costruito con attenzione e – a suo modo – necessario. Offe una base comune per ragionare, comparare e individuare tendenze territoriali. Ma come tutti gli strumenti che mirano a semplificare un Paese complesso, funziona davvero solo se chi lo legge sa interpretarlo, spostare l’attenzione, colmare i vuoti, distinguere ciò che gli indicatori mostrano da ciò che non possono mostrare. Le classifiche servono a orientare, mai a descrivere fino in fondo. L’Italia, in tutte le sue versioni, resta un territorio che va attraversato prima di essere valutato, vissuto prima di essere misurato, compreso prima di essere ordinato in una tabella.
E forse, proprio per questo, ogni indice è utile. Basta ricordarsi che è utile quanto qualsiasi mappa: indica la strada, ma non è il viaggio.
When Metrics Describe Italy, but Don’t Quite Explain It
A considered reading of the City Vision Score 2025–2026
The City Vision Score 2025–2026 is one of those works that deserves to be taken seriously. It is built on a clear methodological structure, draws on institutional datasets, and organises thirty indicators into a framework designed to capture the “smartness” of Italian municipalities in their digital and administrative evolution. It is a complex and necessary exercise, especially in a country that rarely examines itself through a comparable national lens.
And yet, precisely because of its scientific ambition, the City Vision Score opens up a series of questions worth considering—not to undermine the tool, but to understand its nature and its limits. An index is never just an index: it is also a way of looking at a country, interpreting it, making it legible. And legibility, in Italy, is always a delicate terrain.
The report declares a solid methodology: thirty indicators, six thematic dimensions—from governance to mobility, from smart economy to smart living—normalisation of data, population-size segmentation, and macro-regional divisions. It is a coherent framework, carefully engineered and closely aligned with international literature. But the science of territories doesn’t live solely in indicators. It lives in the choices of what to measure, and what not to measure. It lives in the implicit weights, the value assumptions, and those technical preferences that are rarely spelled out but guide the reading far more than raw numbers ever could.
The results, in many respects, are unsurprising. Northern Italy—especially the North-East—continues to dominate, with Bologna, Trento, the broader Emilia-Romagna ecosystem and the Trentino-Alto Adige constellation all benefitting from administrative capacity, strong infrastructure, and long-standing governance traditions. The report itself acknowledges this openly, noting that the gap is no longer episodic but structural, fuelled by historical endowments, consistent investment, and organisational continuity. It is an honest description, but also a reminder: when an index measures outcomes rather than distance travelled, the territories that began with an advantage will inevitably remain ahead.
The most revealing case is the 2,001–50,000 category, by far the broadest and, paradoxically, the most homogenised. Within this single statistical band coexist wildly different worlds: towns of 2,300 residents with three municipal employees and a complex rural hinterland are evaluated alongside centres of 40,000 or 45,000 inhabitants equipped with hospitals, secondary schools, advanced services, structured businesses, and financial capacity of an entirely different order. Statistical logic demands coherent classes; Italy’s territorial reality would require distinguishing between those who can do much, those who can do little, and those who manage to do remarkably well despite the odds. In this sense, the Score absorbs—and erases—the specificity of the “true small town,” the ones that sit just above 2,000 residents but far below 10,000. These are, very often, the most interesting places to observe: large enough to be alive, small enough to be fragile, dense enough to form community, but not large enough to sustain complex administrative machinery. Within the Score, however, they dissolve into anonymity.
The “Smart Living” dimension reveals the other side of the phenomenon. The very smallest municipalities, those below 2,000 inhabitants, consistently dominate. Not because they feature cutting-edge services or extraordinary administrative capacity, but because their demographic structure predisposes them to perform well: low density, moderate living costs, social cohesion, and a slower daily rhythm that translates—within the logic of the index—into higher quality of life. It is a result entirely consistent with the chosen indicators, but also a reminder of how an index, however scientific, ends up measuring structural traits more than deliberate policy actions or intentional forms of innovation.
This is not a flaw. It is simply the nature of territorial indices. But the gap between what can be measured and what truly defines a place remains vast. To understand a municipality, it is not enough to know how many pharmacies it has or how many digital services it has activated. One has to enter it, walk through it, speak with people, observe what escapes datasets, feel the texture of a street at eight in the evening or the silence of an alley at dawn. This is not only true for borghi. It is true for medium-sized towns, internal areas, and those interstitial small centres that never appear in “smart city” narratives but represent most of the country’s living fabric.
Ultimately, the City Vision Score is a useful, serious, carefully constructed, and—at its core—necessary piece of work. It provides a common ground for reflection, comparison, and the identification of broader territorial trends. But like all tools that aim to simplify a complex country, it works only if readers know how to interpret it, shift their perspective, fill the gaps, and distinguish what the indicators reveal from what they cannot reveal. Rankings are meant to orient, never to fully describe. Italy, in its many versions, remains a territory that must be walked before it is assessed, lived before it is quantified, understood before it is arranged in a table.
And perhaps this is precisely the point: an index is always useful. As long as one remembers that it is as useful as any map. It shows the route, but it is not the journey.